The Factory Decision That Cost One Brand $280,000
In 2021, a mid-sized beverage startup based in Austin, Texas locked in a packaging deal with a supplier in the Pearl River Delta, China. The lead times were long but the per-unit price was irresistible. Nine months later, pandemic-related port congestion, a surge in ocean freight rates, and a currency shift wiped out every dollar of savings. They ended up paying more than a domestic supplier would have charged, and they had nothing on shelves for 11 weeks.
That story is not unique. I have heard variations of it from brand managers in cosmetics, food and beverage, electronics, and consumer goods. The packaging sourcing decision feels like a cost calculation when you sit down to make it. In reality, it is a geopolitical, infrastructural, and logistical bet that most companies are not fully equipped to evaluate.
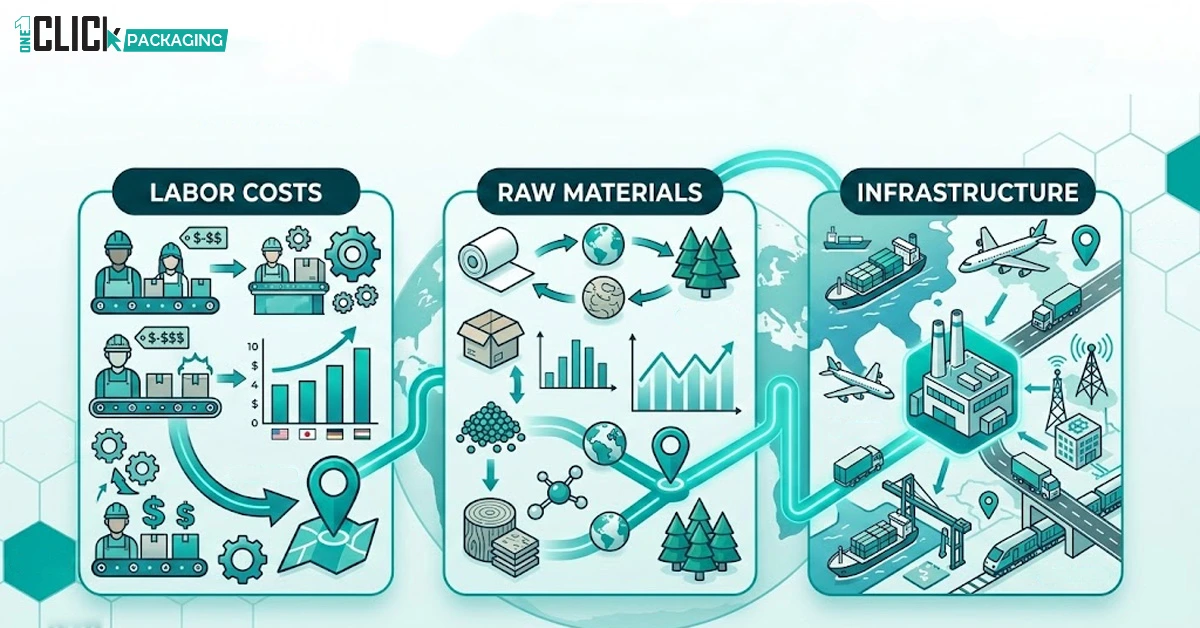
So what actually drives the decision about where packaging gets made when companies are comparing different box packaging solutions across regions? The honest answer involves three forces that interact in ways most sourcing guides never bother to explain: labor costs, raw material availability, and infrastructure quality. Get the balance right and you build a cost-efficient, resilient supply chain. Miss it and you absorb surprises that no spreadsheet predicted.
This article breaks all three forces down, shows you how they interact in practice, and gives you a framework for thinking about packaging geography that goes well beyond the cheapest quote you can find online.
Many founders underestimate how sourcing decisions impact costs and supply stability. Our Complete Guide to Packaging Sourcing for Small Businesses explores these decisions in detail.
Why Labor Costs Are More Complicated Than the Hourly Rate
The first question most buyers ask is: ‘What do workers earn over there?’ It is a fair starting point and a deeply incomplete one. Labor cost is not just a wage. It is a composite figure that includes benefits and mandatory social contributions, worker productivity and output quality per hour, supervisory overhead, rework rates and the cost of defects, and regulatory compliance costs like safety enforcement, minimum wage escalation, and overtime laws.
Vietnam’s manufacturing wages averaged around $280 per month in 2023, compared to roughly $3,400 per month for a production worker in the United States. On paper, that gap looks enormous. In practice, companies sourcing packaging from Ho Chi Minh City report that productivity differences, quality control costs, and communication overhead regularly close that gap by 30 to 50 percent. The landed cost after freight, duties, and carrying inventory for 10 additional weeks tends to narrow things further.
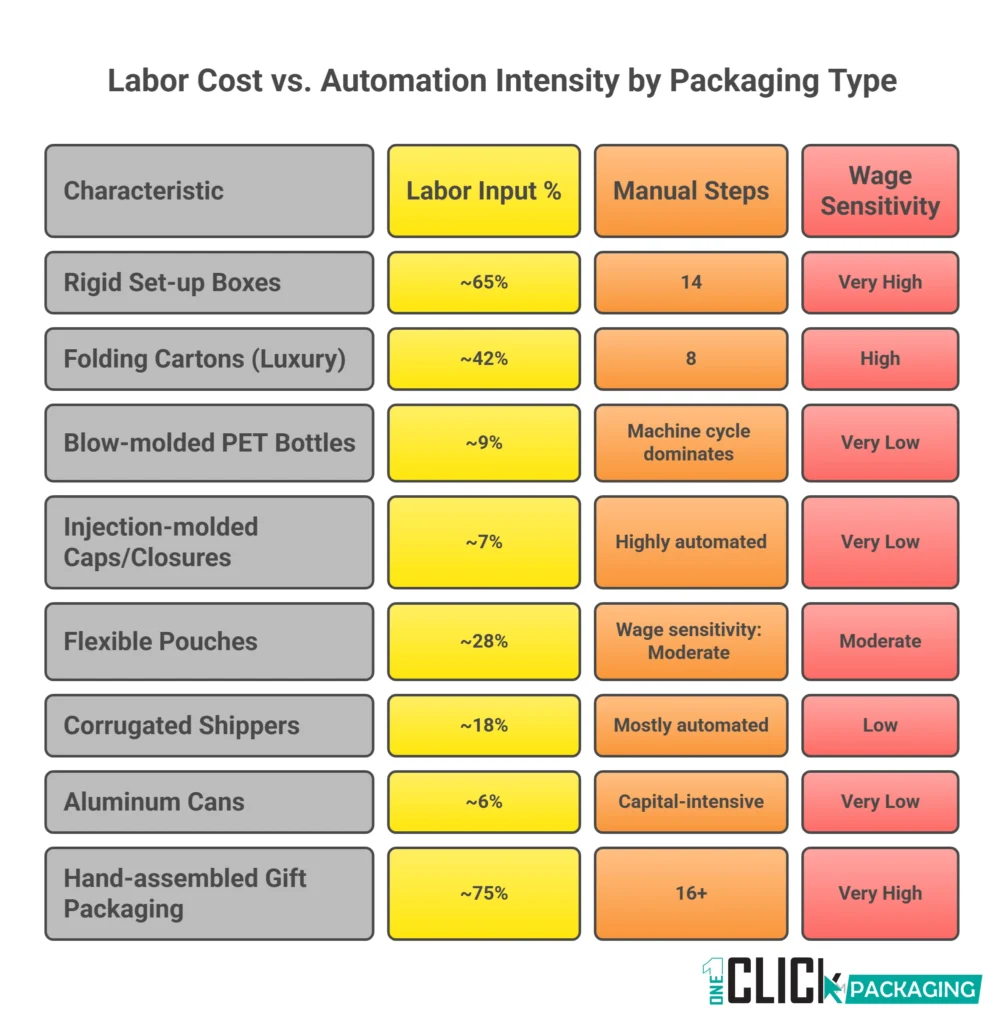
Where labor cost advantages hold up most reliably is in highly labor-intensive packaging formats such as tights packaging and other apparel retail cartons. Hand-assembled gift boxes, complex folding carton structures, custom rigid boxes, and multi-component luxury packaging all benefit significantly from lower-wage manufacturing environments. A rigid luxury box assembled in Guangdong with 14 manual steps costs far less than one assembled in Germany, full stop.
Where the advantage erodes quickly is in automated packaging formats. Blow-molded PET bottles, injection-molded caps, and corrugated shipping cases are all produced on capital-intensive machinery where labor is a minor input. A modern blow molding facility in South Carolina and one in Thailand have similar labor cost profiles because neither one employs many people relative to output volume. The machine cycle time dominates the cost structure, not the wage bill.
The Rise of Automation Is Reshuffling the Map
This matters enormously right now because automation is accelerating across packaging manufacturing. Robotic palletizing, automated quality inspection using computer vision, and AI-driven press setup are reducing labor intensity in categories that previously justified offshore sourcing on wage grounds alone. Mexico, Poland, and Malaysia are all positioning themselves as semi-automated packaging hubs that offer reasonable wages, growing technical labor pools, and better logistics than pure low-cost alternatives.
My honest take: if you are sourcing a packaging format that runs on a standard machine with low manual input, proximity and logistics reliability matter more than labor arbitrage. If you are sourcing hand-finished, labor-intensive packaging at meaningful volume, low-wage manufacturing regions still offer genuine cost advantages that automation has not yet erased.
Automation is only one part of the equation. Our guide What Really Determines Where Packaging Gets Manufactured Around the World explores the broader forces shaping global packaging production.
Raw Material Access: The Upstream Factor Nobody Wants to Model
Every packaging format starts as a raw material. Paperboard begins as virgin wood pulp or recovered fiber. Glass packaging begins as silica sand, soda ash, and limestone. Aluminum starts as bauxite ore. Rigid plastics begin as petrochemical feedstocks derived from crude oil and natural gas. The geographic distribution of these inputs shapes packaging manufacturing clusters in ways that are often invisible to buyers who think purely in terms of finished goods.
China’s dominance in corrugated and folding carton packaging is partly explained by its massive domestic paper and paperboard industry, built on a combination of imported recovered fiber and an enormous installed base of integrated paper mills. The Pearl River Delta is a paperboard cluster partly because the raw material is close, cheap, and consistent. Moving production to a country without that upstream industry means absorbing import costs and supply risks that erode the apparent manufacturing advantage.
Glass packaging, especially formats used in custom cosmetic packaging boxes, is a classic example of raw material geography driving manufacturing location. This dynamic is also visible in specialty food formats such as chocolate truffle packaging boxes, where board quality, print finish, and regional paper supply influence sourcing decisions. The heavy raw inputs, the energy intensity of glass melting, and the fragility of finished product all make it economically irrational to ship glass very far. That is why glass packaging for wine and spirits tends to be produced regionally close to the end market. European glass packaging is made in Europe. American wine bottles are mostly made in the United States, with some sourcing from Chile and Mexico for cost-sensitive applications.
The Petrochemical Backbone of Plastic Packaging
Plastic packaging is more globally mobile than glass but still follows the petrochemical feedstock chain. The Gulf Coast of the United States is one of the world’s lowest-cost environments for producing polyethylene and polypropylene because it sits on top of abundant domestic natural gas and shale-derived ethane. That feedstock advantage flows through into competitive resin pricing for American packaging converters. Saudi Arabia and the UAE have built enormous petrochemical complexes on the same logic, making them significant exporters of plastic packaging material to markets where feedstock is more expensive.
Aluminum packaging follows a slightly different logic. The smelting of primary aluminum is extraordinarily energy-intensive, which means it migrates to wherever electricity is cheap. Iceland, Canada, and the Pacific Northwest of the United States all have aluminum smelting capacity because of abundant hydroelectric power. Downstream can-making and foil rolling is more footloose, but still clusters near the primary smelting capacity because shipping aluminum ingot is cheaper than shipping finished packaging.
Recycled Content Is Changing the Raw Material Map
One development that is genuinely reshuffling packaging manufacturing geography right now is the push for recycled content in segments such as herbal product packaging. European brands facing EPR (Extended Producer Responsibility) legislation and American brands responding to state-level recycled content mandates are both creating demand for packaging made with post-consumer recycled material. This is pulling manufacturing toward markets with established collection and sorting infrastructure, meaning Western Europe, the US, and Japan. A Chinese packaging plant, however cost-efficient, may not be able to source the certified recycled resin content that a US brand needs for regulatory compliance.
That regulatory pull is real. I know a cosmetics brand that moved a significant portion of its rigid plastic packaging production back to a converter in New Jersey in 2023 specifically because they needed verified PCR resin traceability for a California market SKU. The per-unit cost went up 18 percent. The regulatory risk went away entirely. That trade-off is one more companies are making.
Raw Material Proximity by Packaging Format
Understanding how raw materials influence production cost is especially important when sourcing formats like apparel shipping boxes or corrugated transport packaging
| Packaging Format | Primary Raw Material | Key Producing Regions | Transportability |
| Corrugated / Folding Carton | Paperboard / Kraft | China, USA, Germany, Brazil | Good — ships flat |
| Glass Bottles & Jars | Silica sand, soda ash | Regional (heavy, fragile) | Poor — produced near market |
| PET Bottles | PET resin (petrochemical) | China, USA, India, Turkey | Moderate — nests well |
| Aluminum Cans & Foil | Bauxite / primary Al | USA, Europe, Gulf States | Good — ships flat |
| Rigid Plastic (HDPE/PP) | Polyolefin resins | USA Gulf Coast, Middle East | Good — nestable formats |
| Flexible Packaging | Multi-layer film laminates | China, India, Poland, USA | Excellent — high density |
Infrastructure: The Multiplier That Makes or Breaks the Cost Model
Here is what most packaging sourcing articles skip entirely: infrastructure quality is the single biggest determinant of whether a low-cost manufacturing region actually delivers low-cost packaging at your door. Labor savings mean nothing if the roads between the factory and the port are slow, if the port is congested, if customs clearance takes three weeks, or if the local electricity grid produces voltage fluctuations that damage sensitive machinery and increase defect rates.
Infrastructure for packaging manufacturing encompasses several distinct systems. Physical infrastructure means roads, rail, ports, and warehousing. Energy infrastructure means reliable, affordable electricity and natural gas. Digital infrastructure means the communication networks that support quality management systems, real-time production monitoring, and documentation flows. And institutional infrastructure means the customs systems, regulatory bodies, and legal frameworks that govern international trade.
Bangladesh is an instructive case. Its garment industry is globally dominant partly because labor is extremely cheap and partly because Chittagong port, for all its inefficiencies, handles apparel export volume reasonably well. But packaging manufacturing in Bangladesh remains limited because the upstream raw material supply chain is weak, energy reliability is inconsistent, and the industrial infrastructure for precision manufacturing, converters, coaters, and printers, is thin. Low labor cost is present. The infrastructure to capitalize on it in a packaging context largely is not.
Port Quality and Lead Time Are Inseparable
When packaging buyers compare sourcing options, they often focus on factory gate price and miss the lead time cost entirely. Lead time cost is not just the time value of money on inventory in transit. It is the safety stock you have to carry to protect against variability, the warehouse space to hold that safety stock, the working capital tied up in goods afloat, and the obsolescence risk if your design or formulation changes while a container is at sea.
A packaging factory in Mexico that is 10 percent more expensive per unit than one in Vietnam may actually deliver better total cost of ownership because the lead time from Monterrey to Los Angeles is 5 to 7 days versus 25 to 35 days from Ho Chi Minh City. At meaningful volume, the inventory carrying cost difference alone can offset a significant per-unit price gap. The Austin beverage startup I mentioned at the opening learned this at significant cost.
The Nearshoring Infrastructure Dividend
This is why nearshoring is more than a trend. It is a rational response to the full-cost accounting of offshore production. Mexico has made substantial infrastructure investments since NAFTA/USMCA, and its manufacturing corridor from Monterrey down to Queretaro now supports sophisticated packaging production including multi-layer flexible packaging, complex folding cartons, glass, and aluminum. Poland has become a credible packaging manufacturing hub for European brands for exactly the same reasons: EU-funded infrastructure, skilled workers at Eastern European wage rates, and road/rail connections that allow just-in-time delivery across the continent.
Morocco is an emerging story worth watching. With the Tanger Med port now ranking among Africa’s top three container facilities, a growing industrial free zone, and proximity to Southern European markets, it is attracting packaging investment from brands that previously went to Turkey or Egypt. The infrastructure bet is still maturing, but the trajectory is clear.
If you’re comparing domestic and international production options, the guide below explores whether local packaging manufacturing justifies the higher cost.
How the Three Forces Interact in Real Sourcing Decisions
Labor cost, raw material availability, and infrastructure quality do not operate independently. They interact, and the interaction is what creates actual packaging manufacturing clusters. Understanding the interaction is more valuable than scoring each factor separately when sourcing structural formats like auto parts packaging across regions.
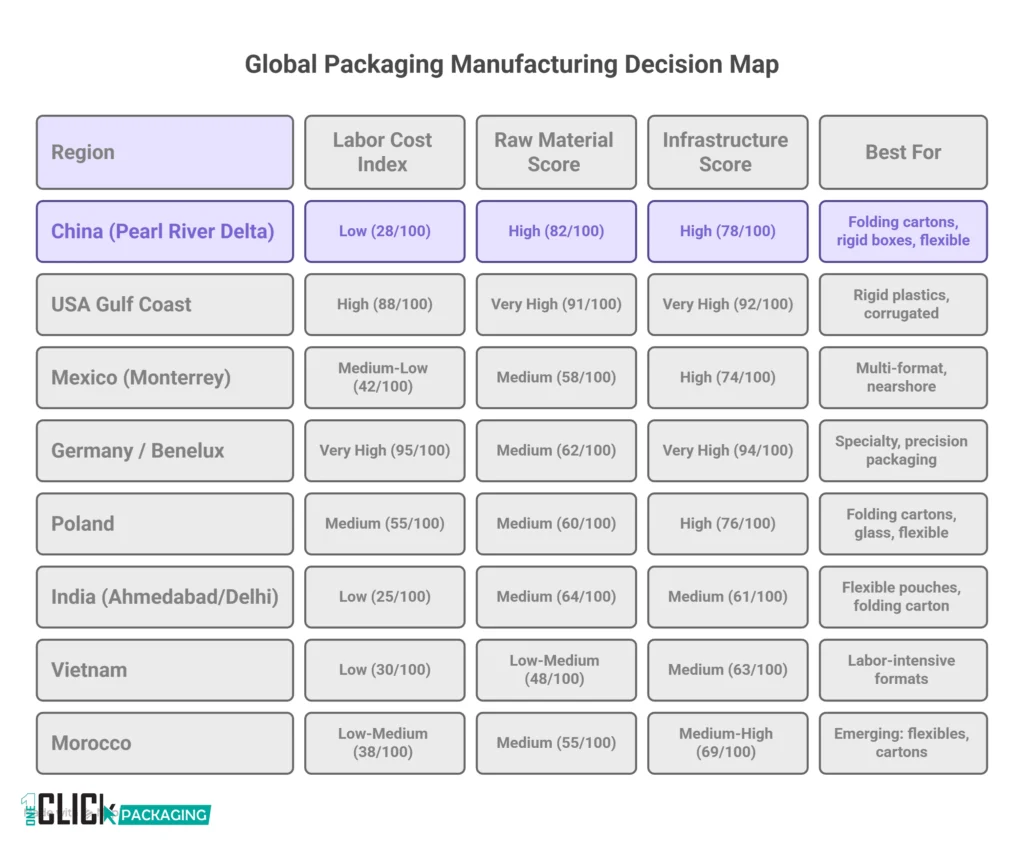
China’s dominance in corrugated, folding carton, rigid set-up boxes, and flexible packaging is not an accident. It reflects a combination of low labor costs in comparison to developed markets, massive domestic paperboard and petrochemical industries that reduce raw material costs, and port infrastructure in Shenzhen, Shanghai, and Ningbo that is genuinely world-class in terms of volume and efficiency. All three factors align.
The US Gulf Coast’s strength in rigid plastic packaging reflects cheap feedstock from shale gas, mature automated production infrastructure, and the logistics advantage of serving the largest consumer packaged goods market in the world from within it. Labor costs are higher than Asia, but they are less relevant to automated production, and domestic sourcing eliminates the lead time and currency risk that offshore alternatives carry.
Germany’s position as a premium machinery and specialty packaging supplier reflects a different alignment: very high labor costs offset by exceptionally high automation intensity and precision engineering capability, world-class logistics infrastructure within the EU, and a manufacturing culture that supports complex, high-tolerance packaging formats that lower-cost regions struggle to replicate consistently.
Three Case Studies in Sourcing Geography
Case Study 1: A luxury candle brand I consulted for in 2022 was sourcing rigid glass vessels from China. Quality was acceptable but the 14-week lead time was strangling their ability to respond to new fragrance launches. We moved them to a glass supplier in Poland. Cost per unit went up 22 percent. Lead time dropped to 6 weeks. They launched four new SKUs in 18 months that would have been impossible to support on the previous supply chain. The revenue from those launches more than covered the cost increase.
Case Study 2: A private label food brand was sourcing flexible packaging solutions similar to bakery packaging boxes and other food-grade formats from India. The unit price was excellent. But a 6-month review revealed that 8 percent of incoming shipments failed seal integrity testing on arrival, requiring rework or disposal. Once we factored in the defect cost, the Indian supplier was more expensive than a Polish alternative on a total landed, reworked, quality-assured basis. Infrastructure quality, in this case the Indian supplier’s quality management systems and process consistency, was the hidden cost driver.
Case Study 3: A direct-to-consumer supplement brand needed printed folding cartons with very high graphic fidelity. An initial quote from a US converter was $0.38 per carton. A comparable quote from a Chinese printer was $0.14. After factoring in 16-week lead time, minimum order quantities of 250,000 units, freight, duties, and the working capital cost of carrying 14 weeks of inventory, the effective cost delta narrowed to around $0.06 per carton. For a brand doing 40,000 units per month, that was still a meaningful saving. For a brand doing 8,000 units per month, the domestic option was actually cheaper on a total cost basis.
The Tools and Data Sources Worth Using for Packaging Sourcing Research
I want to be specific here because most sourcing advice stays vague. These are tools I have actually used or seen used effectively.
Panjiva (now S&P Global Trade Intelligence) gives you import/export shipment data at the company level. You can see exactly which US brands are importing packaging from which factories, at what volume, via which ports. It is expensive at full enterprise pricing, but the data is genuinely illuminating. Competitor analysis alone can justify the cost.
The World Bank Logistics Performance Index is free and gives you a credible comparative infrastructure quality score for 160-plus countries. It covers customs efficiency, infrastructure quality, international shipments, logistics competence, tracking, and timeliness. Run it alongside labor cost data and you get a rough but useful starting framework.
Freightos and Flexport both offer real-time freight rate data and historical rate charts that are essential for modeling the true cost of ocean shipping at any given moment. During 2021-22, spot container rates hit 10x pre-pandemic levels. Any sourcing model built on 2019 freight assumptions was catastrophically wrong. Current rate data matters.
Alibaba and Global Sources are well-known and worth using for initial discovery, but neither provides quality verification on its own. Pair them with factory audit services like Bureau Veritas, SGS, or QIMA, all of which offer packaging factory audit programs at costs ranging from roughly $300 to $600 per audit. An audit is not a guarantee, but it surfaces systemic problems that no amount of sample-chasing will reveal.
For raw material pricing, the RISI/Fastmarkets Packaging Intelligence service covers paperboard and containerboard globally. ICIS covers petrochemical feedstocks and polymer pricing. Neither is cheap, but they are the sources that sophisticated packaging buyers actually use for contract negotiations.
The Bottom Line on Packaging Geography
Packaging manufacturing geography is not a simple cost optimization problem, especially for brands operating in packaging usa markets. It is a dynamic system shaped by three interacting forces: labor costs that favor different formats and production intensities, raw material availability that anchors certain packaging types to specific geographies, and infrastructure quality that determines whether apparent cost advantages actually survive contact with the real world.
The brands that source packaging effectively are the ones that model all three factors together, update their assumptions regularly, and resist the temptation to chase the lowest factory gate price without understanding what arrives on the other side of that decision.
If I could leave you with one practical commitment: before your next packaging sourcing decision, build a total landed cost model that includes at least six months of current freight data, a quality failure rate assumption from independent audit data, and a carrying cost calculation based on actual lead time variability. It takes an afternoon to build and will save you from the kind of expensive surprise that the Austin startup absorbed.
What does your current packaging sourcing model look like? Are you accounting for these three forces, or are you still working from factory gate price alone? I would genuinely like to know in the comments.
Frequently Asked Questions
Is domestic packaging manufacturing always more expensive?
No, not when you account for total landed cost. Domestic manufacturing eliminates ocean freight, import duties, currency risk, and lead time inventory carrying costs. For brands sourcing lower volumes, complex formats, or rapidly changing designs, domestic production is often cheaper on a full-cost basis even when the factory gate price is higher.
Which packaging formats benefit most from Asian manufacturing?
Labor-intensive formats benefit most, especially formats like pantyhose packaging requiring manual finishing. Complex rigid set-up boxes, fabric-wrapped gift packaging, multi-layer premium folding cartons with foiling and embossing, and hand-assembled components all involve significant manual labor. At scale, Asian manufacturing offers genuine cost advantages that are hard to replicate domestically. Commodity formats running on automated machinery benefit far less.
How much does freight typically add to the cost of packaging from China?
Pre-pandemic, ocean freight from China to US West Coast ports added roughly $0.01 to $0.04 per unit for typical consumer goods packaging, depending on density and box configuration. During the 2021-2022 freight rate spike, that figure tripled or quadrupled. As of 2024, rates have normalized significantly but remain above 2019 levels. Always model freight cost using current spot rates, not historical averages.
What infrastructure factors matter most for packaging quality?
Energy reliability is often underestimated. Inconsistent power supply causes temperature fluctuations during printing, coating, and forming processes, which drives defect rates. Reliable, clean power is a prerequisite for precision packaging production. After energy, road quality between factory and port matters because vibration during transit can damage packaging before it ever reaches your facility.
Is nearshoring just a trend or a permanent shift?
The economics of nearshoring are real and durable, not just a pandemic-era reaction. The calculation has changed because ocean freight is no longer as cheap or predictable as it was in the 2000s, labor cost differentials have narrowed in key Asian markets, and supply chain resilience has moved from theoretical concern to board-level priority. Mexico, Poland, and Morocco all represent genuine structural nearshoring opportunities for US and European brands respectively.
How do raw material costs affect which country I should source from?
Significantly. If your packaging format uses raw materials that are abundant and cheap in a specific region, manufacturing in that region captures a feedstock advantage that compounds the labor and infrastructure calculation. Paperboard packaging from regions with integrated paper industries, glass from regions with cheap silica and energy, and plastic packaging from regions with cheap petrochemical feedstock all carry structural cost advantages that are not visible in a simple labor cost comparison.
What is the biggest mistake companies make in packaging sourcing geography decisions?
Modeling only factory gate price and ignoring total landed cost, including freight, duties, inventory carrying cost, quality failure cost, and working capital cost. The Austin beverage brand in the opening story made exactly this mistake. The second biggest mistake is treating the sourcing decision as permanent. Packaging geography should be reviewed annually against updated freight rates, labor cost trends, currency movements, and regulatory changes.